Sterile Processing Technician Salary in Washington: $55,188 (2026)
Quick Answer:Across Washington's 50 metropolitan areas, the average median sterile processing technician pay sits at $55,188/year heading into 2026 — a figure projected from 2025 BLS OEWS wage data for SOC 31-9093. Because Washington sits at BEA RPP 107.4 (7% above the U.S. baseline), that statewide median translates to roughly $51,385 in nationally-comparable purchasing power. Highest-paying metros: Bellevue ($59,977), Seattle ($59,395), Tacoma ($58,404).
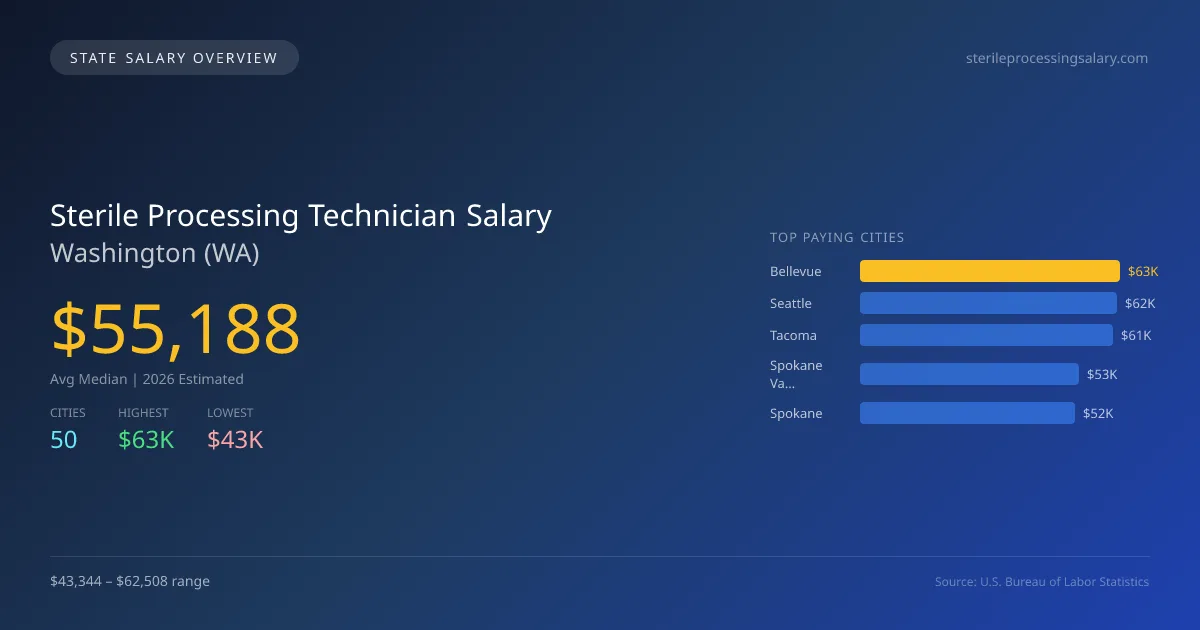
As of 2026, the average median salary for sterile processing technicians in Washington stands at $55,189, which is significantly higher than the national median of $47,724, illustrating a 15.6% premium in the state. The highest paying city, Bellevue, offers a salary of $62,508, while Lacey has the lowest at $43,344, resulting in a salary gap of $19,164. Factors driving these discrepancies include the cost of living, local demand for healthcare services, and varying employer budgets across regions. Washington has specific licensing requirements and scope of practice regulations that contribute to the skilled workforce in this field. Additionally, the demand for sterile processing technicians is bolstered by the ongoing growth of healthcare facilities and services, underscored by a projected annual growth rate of 4.22% in the job market. Top cities for employment in 2026 include Seattle at $61,901, Tacoma at $60,869, Spokane Valley at $52,681, and Spokane at $51,687, reflecting strong regional demand. With nearly 1,936 sterile processing technicians employed, the job market is stable, offering opportunities for those seeking to establish a career in this essential healthcare support role.
Washington Sterile Processing Technician Salary Range
Overall salary range in Washington: $33,533 (lowest entry-level) to $96,451 (highest top earner)
Washington vs National Average
Washington sterile processing technicians earn 15.64% more than the national median (+$7,464/year difference).
Washington Sterile Processing Technician Salary Distribution (2026)
Sterile Processing Technician salaries in Washington range from $42,404 (entry-level, 10th percentile) to $76,124 (top earners, 90th percentile), with a median of $55,188. The Washington median is $7,464 above the US national median of $47,724. The average hourly rate is $26.54/hr. Approximately 1,936 sterile processing technicians are employed across 50 cities.
2019 BLS Actual
$40,692
2025 BLS Actual
$52,954
2026 Current Est.
$55,188
2019–2027 Growth
+41.3%
Salary Trajectory for Sterile Processing Technicians in Washington (2019–2027)
2019–2025: actual BLS OEWS data for this metro area. 2026+: CAGR 4.22% projection.
| Year | Annual Salary | Status |
|---|---|---|
| 2019 | $40,692 | Actual |
| 2020 | $43,297 | Actual |
| 2021 | $44,439 | Actual |
| 2022 | $45,762 | Actual |
| 2023 | $51,780 | Actual |
| 2024 | $54,599 | Actual |
| 2025 | $52,954 | Actual |
| 2026(current) | $55,188 | Estimated |
| 2027 | $57,517 | Projected |
Based on 7 years of BLS OEWS data for the Washington metropolitan area, the median sterile processing technician salary grew 30.1% from $40,692 (2019) to $52,954 (2025). At a 4.22% compound annual growth rate, salaries are projected to reach $57,517 by 2027 — a total increase of $16,825 (41.35%) from 2019.
Note: Historical values (2019–2025) are actual BLS OEWS figures for the Washington metropolitan area, sourced from annual Occupational Employment and Wage Statistics surveys. 2026–2026 figures are current estimates, and 2027 values are projections, calculated using a 4.22% CAGR derived from 7-year BLS historical data. Actual salaries may vary based on employer, experience, certifications, and local market conditions.
Top 5 Highest Paying Cities in Washington
Lowest Paying Cities in Washington
| City | Median Salary |
|---|---|
| Lacey | $43,344 |
| Olympia | $43,703 |
| Tumwater | $44,103 |
| Tukwila | $44,436 |
| Mountlake Terrace | $44,505 |
Best Value Cities for Sterile Processing Technicians in Washington
When adjusted for local cost of living, these Washington cities offer the most purchasing power for sterile processing technicians.
| City | Nominal Salary | CoL Index | Adjusted Salary |
|---|---|---|---|
| Bellevue | $62,508 | 107.4 | $58,201 |
| Tacoma | $60,869 | 107.4 | $56,675 |
| Seattle | $61,901 | 111.133 | $55,700 |
| Spokane | $51,687 | 100.346 | $51,509 |
| Wenatchee | $51,387 | 103.855 | $49,480 |
Adjusted salary = nominal salary × (100 / CoL index). CoL index: 100 = national average. Lower index = lower cost of living.
Salary by Experience Level in Washington
| Experience Level | Estimated Annual |
|---|---|
| Entry Level (0-2 years) | $42,404 |
| Mid Career (3-7 years) | $55,188 |
| Experienced (7+ years) | $76,124 |
Estimates based on BLS percentile data averaged across Washington metro areas. Individual pay varies by employer, certifications, and specialization.
All 50 Cities in Washington
| # | City | Median Salary |
|---|---|---|
| 1 | Bellevue | $62,508 |
| 2 | Seattle | $61,901 |
| 3 | Tacoma | $60,869 |
| 4 | Spokane Valley | $52,681 |
| 5 | Spokane | $51,687 |
| 6 | Wenatchee | $51,387 |
| 7 | Vancouver | $51,354 |
| 8 | Renton | $49,330 |
| 9 | Mount Vernon | $49,095 |
| 10 | Richland | $49,076 |
| 11 | Everett | $48,852 |
| 12 | Marysville | $48,486 |
| 13 | Shoreline | $48,221 |
| 14 | Kennewick | $48,075 |
| 15 | Redmond | $48,030 |
| 16 | Kent | $47,990 |
| 17 | Kirkland | $47,912 |
| 18 | Burien | $47,851 |
| 19 | Federal Way | $47,641 |
| 20 | Des Moines | $47,631 |
| 21 | Auburn | $47,519 |
| 22 | Lakewood | $47,500 |
| 23 | Issaquah | $47,473 |
| 24 | Bellingham | $47,464 |
| 25 | Sammamish | $47,162 |
| 26 | University Place | $47,145 |
| 27 | SeaTac | $47,108 |
| 28 | Pasco | $46,906 |
| 29 | Longview | $46,884 |
| 30 | Bremerton | $46,764 |
| 31 | Edmonds | $46,620 |
| 32 | Lake Stevens | $46,497 |
| 33 | Lynnwood | $46,466 |
| 34 | Moses Lake | $46,377 |
| 35 | Bothell | $46,344 |
| 36 | Pullman | $46,138 |
| 37 | Yakima | $46,043 |
| 38 | Puyallup | $46,034 |
| 39 | Ellensburg | $45,861 |
| 40 | Maple Valley | $45,735 |
| 41 | Walla Walla | $45,635 |
| 42 | Camas | $45,619 |
| 43 | Oak Harbor | $45,427 |
| 44 | Kenmore | $45,135 |
| 45 | Covington | $45,130 |
| 46 | Mountlake Terrace | $44,505 |
| 47 | Tukwila | $44,436 |
| 48 | Tumwater | $44,103 |
| 49 | Olympia | $43,703 |
| 50 | Lacey | $43,344 |
More Washington Salary Data
Hourly Rates
Explore sterile processing technician hourly pay in Washington cities.
Senior / Experienced
Top earner salaries for experienced sterile processing technicians.
Compare Cities in Washington
View all comparisons →Explore More Sterile Processing Technician Salary Data
Frequently Asked Questions
How much do sterile processing technicians make in Washington in 2026?
What is the highest paying city for sterile processing technicians in Washington?
How does Washington sterile processing technician pay compare to the national average?
What is the entry-level sterile processing technician salary in Washington?
How many sterile processing technicians are employed in Washington?
Which Washington city offers the best value for sterile processing technicians?
Written by Amina Patel, CCSVP
Career Analyst
Amina has 8 years of experience in sterile processing. She specialized in instrument sterilization techniques in a large hospital. Amina analyzes career trends for sterile processing technicians.
Methodology & Data Source
Statewide salary figures on this page are 2026 projections based on the Bureau of Labor Statistics Occupational Employment and Wage Statistics (OEWS) survey, May 2026 release. A 4.22% compound annual growth rate (CAGR), derived from 6-year national BLS wage trends, was applied to each metro area's reported salary to estimate current 2026 sterile processing technician compensation across Washington. State averages are employment-weighted across 50 metro areas — larger metro areas with more sterile processing technicianscontribute proportionally more to the average, producing figures that better reflect typical compensation. Individual pay varies by city, employer, certifications, and experience.
Data Sources & Methodology
Source: BLS, OEWS, 7-year dataset (–). Per-city data from annual BLS metropolitan area surveys.
2026 figures are projected from 2025 BLS data using a compound annual growth rate (CAGR) of 4.22%, derived from historical BLS wage trends for sterile processing technicians (SOC 31-9093).
Compiled and verified by Amina Patel, CCSVP, a licensed sterile processing technician with 10+ years of clinical experience. · View source data at BLS.gov