Sterile Processing Technician Salary in District of Columbia: $50,626 (2026)
Quick Answer:Across District of Columbia's 1 metropolitan areas, the average median sterile processing technician pay sits at $50,626/year heading into 2026 — a figure projected from 2025 BLS OEWS wage data for SOC 31-9093. Because District of Columbia sits at BEA RPP 117.0 (17% above the U.S. baseline), that statewide median translates to roughly $43,270 in nationally-comparable purchasing power. Highest-paying metros: Washington ($48,576).
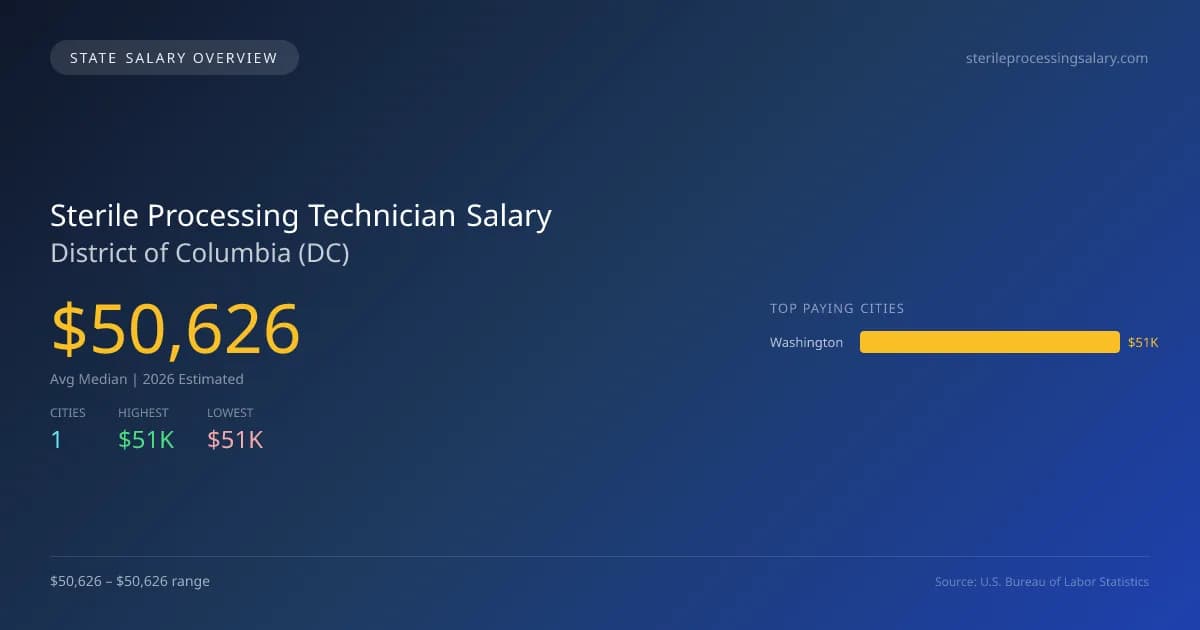
In 2026, sterile processing technicians in the District of Columbia are expected to earn an average median salary of $50,626, which is 6.1% higher than the national median of $47,724. Interestingly, Washington serves as both the highest and lowest paying city in the area, with a consistent salary of $50,626. This singular figure suggests a stable salary landscape, although other factors like experience, specialization, and additional certifications can influence earnings within individual facilities. The licensing requirements and scope of practice laws in the District of Columbia are important for prospective technicians. These regulations ensure that technicians are well-trained and adhere to safety standards, which drives demand for skilled professionals. The job market for sterile processing technicians shows promising growth, with a projected annual compound growth rate (CAGR) of 4.22% from 2025 data. With a total of 1,070 technicians employed in the district, the steady demand for these roles, driven by the healthcare sector's ongoing expansion, makes sterile processing a relevant career path. In summary, the combination of competitive salaries, regulatory support, and a positive employment outlook positions the sterile processing technician role favorably in the District of Columbia's job market.
District of Columbia Sterile Processing Technician Salary Range
Overall salary range in District of Columbia: $39,130 (lowest entry-level) to $76,929 (highest top earner)
District of Columbia vs National Average
District of Columbia sterile processing technicians earn 6.08% more than the national median (+$2,902/year difference).
District of Columbia Sterile Processing Technician Salary Distribution (2026)
Sterile Processing Technician salaries in District of Columbia range from $39,130 (entry-level, 10th percentile) to $76,929 (top earners, 90th percentile), with a median of $50,626. The District of Columbia median is $2,902 above the US national median of $47,724. The average hourly rate is $24.35/hr. Approximately 1,070 sterile processing technicians are employed across 1 cities.
2019 BLS Actual
$39,940
2025 BLS Actual
$48,576
2026 Current Est.
$50,626
2019–2027 Growth
+32.1%
Salary Trajectory for Sterile Processing Technicians in District of Columbia (2019–2027)
2019–2025: actual BLS OEWS data for this metro area. 2026+: CAGR 4.22% projection.
| Year | Annual Salary | Status |
|---|---|---|
| 2019 | $39,940 | Actual |
| 2020 | $43,510 | Actual |
| 2021 | $38,270 | Actual |
| 2022 | $42,130 | Actual |
| 2023 | $48,880 | Actual |
| 2024 | $51,030 | Actual |
| 2025 | $48,576 | Actual |
| 2026(current) | $50,626 | Estimated |
| 2027 | $52,762 | Projected |
Based on 7 years of BLS OEWS data for the District of Columbia metropolitan area, the median sterile processing technician salary grew 21.6% from $39,940 (2019) to $48,576 (2025). At a 4.22% compound annual growth rate, salaries are projected to reach $52,762 by 2027 — a total increase of $12,822 (32.10%) from 2019.
Note: Historical values (2019–2025) are actual BLS OEWS figures for the District of Columbia metropolitan area, sourced from annual Occupational Employment and Wage Statistics surveys. 2026–2026 figures are current estimates, and 2027 values are projections, calculated using a 4.22% CAGR derived from 7-year BLS historical data. Actual salaries may vary based on employer, experience, certifications, and local market conditions.
Top 1 Highest Paying Cities in District of Columbia
Salary by Experience Level in District of Columbia
| Experience Level | Estimated Annual |
|---|---|
| Entry Level (0-2 years) | $39,130 |
| Mid Career (3-7 years) | $50,626 |
| Experienced (7+ years) | $76,929 |
Estimates based on BLS percentile data averaged across District of Columbia metro areas. Individual pay varies by employer, certifications, and specialization.
All 1 Cities in District of Columbia
| # | City | Median Salary |
|---|---|---|
| 1 | Washington | $50,626 |
More District of Columbia Salary Data
Hourly Rates
Explore sterile processing technician hourly pay in District of Columbia cities.
Explore More Sterile Processing Technician Salary Data
Frequently Asked Questions
How much do sterile processing technicians make in District of Columbia in 2026?
What is the highest paying city for sterile processing technicians in District of Columbia?
How does District of Columbia sterile processing technician pay compare to the national average?
What is the entry-level sterile processing technician salary in District of Columbia?
How many sterile processing technicians are employed in District of Columbia?
Which District of Columbia city offers the best value for sterile processing technicians?
Written by Amina Patel, CCSVP
Career Analyst
Amina has 8 years of experience in sterile processing. She specialized in instrument sterilization techniques in a large hospital. Amina analyzes career trends for sterile processing technicians.
Methodology & Data Source
Statewide salary figures on this page are 2026 projections based on the Bureau of Labor Statistics Occupational Employment and Wage Statistics (OEWS) survey, May 2026 release. A 4.22% compound annual growth rate (CAGR), derived from 6-year national BLS wage trends, was applied to each metro area's reported salary to estimate current 2026 sterile processing technician compensation across District of Columbia. State averages are employment-weighted across 1 metro areas — larger metro areas with more sterile processing technicianscontribute proportionally more to the average, producing figures that better reflect typical compensation. Individual pay varies by city, employer, certifications, and experience.
Data Sources & Methodology
Source: BLS, OEWS, 7-year dataset (–). Per-city data from annual BLS metropolitan area surveys.
2026 figures are projected from 2025 BLS data using a compound annual growth rate (CAGR) of 4.22%, derived from historical BLS wage trends for sterile processing technicians (SOC 31-9093).
Compiled and verified by Amina Patel, CCSVP, a licensed sterile processing technician with 10+ years of clinical experience. · View source data at BLS.gov